Image Analysis: Colour Palette Generator
Tools used: Python 3, Matplotlib, colourgram and webcolors
Abstract
This colour palette generator analyses multiple images and calculates the most common colours within each image.
With the comination of a few Python modules, we are able to use hexadecimal and RGB values and convert them to their nearest colour ID.
Finally, we use Matplotlib to plot our colours and output an image file for out colour palette.
Requirements
There are a few Python 3 packges requried for this tool:
- pip install colorgram.py - colourgram is a simple module which allows us to get the RGB and HSL values from an image
- pip install webcolors - this module provides HTML and CSS colour definitions, allowing us to convert RBG and other colour formats their closest colour names
- pip install matplotlib - we are using matplotlib to view and save our colour palettes
Extracting Colours
The first step is to extract the most dominant colours from each image. We do this using colorgram. colorgram has a simple .extract function which gives us the following datapoints for each image:
- Most dominant Red, Green and Blue values (RGB) within the image
- Hue, Saturation and Light (HSL) values for each RGB value
- Proportion (%) of the image which each RGB value takes up
The following function takes a folder from your directory, loads each image file and extracts the RGB and proportion values. These are all saved into a list of lists:
import os
import math
import colorgram
import webcolors
import matplotlib.pyplot as plt
from PIL import Image

TOP_COLOUR_SKIP = 0
MAIN_FOLDER = 'images/'
IMAGE_FOLDER = os.listdir(MAIN_FOLDER)
COLOURS_WANTED = 30
proportions = []
def extract_colour_values(folder):
TEMP_FOLDER_IMAGES = os.listdir(MAIN_FOLDER + folder)
FOLDER_IMAGES = [file_name for file_name in TEMP_FOLDER_IMAGES]
FILE_COUNT = len(FOLDER_IMAGES)
print(f"Number of images processing: {FILE_COUNT}")
colour_extracts = []
closet_colour_name = []
for filename in FOLDER_IMAGES[:FILE_COUNT]:
print(filename)
# Extract X colours from the image
img = Image.open(MAIN_FOLDER + folder + "/" + filename)
# resize the image to speed up processing
img = img.resize((160,300),Image.ANTIALIAS)
colours = colorgram.extract(img, 999)
for color in colours:
colour_extracts.append((color.rgb.r, color.rgb.g, color.rgb.b, color.proportion, filename))
return colour_extractscologram.extract takes in two parameters: 1) path to the image and 2) max number of colours to extract from the image. Don't get this max number of colours confused with the 'COLOURS_WANTED' constant at the start of the script. Here, we are simply setting a max for the specific image, whereas COLOURS_WANTED refers to the number of colours we want for our output palette.
The above function uses an image folder, which contains multiple other folders. Each folder has it's own set of images (one palette per folder). For this example, we only have 1 set of images
With this, we can start to write our main function. Save the colour extract data to a list and sort this list by the RGB proportion index (3ith index). We want to do this so we have the most dominant colours, from all images combined, at the start of the list
def print_palette(folder):
    print(f"Folder Name: {folder}")
    colour_extracts = extract_colour_values(folder)
    colour_extracts.sort(key=lambda x: x[3], reverse=True)
Next, we start to build our matplotlib figure. We set the figsize, title and turn off the axis.
We also set the number of columns and rows we want our palette to use. Here, we use the number of colours we want and split it into rows of 10
  fig = plt.figure(figsize=(24, 14))
    plt.title(folder.title(), fontsize=25)
    plt.axis('off')

    palette_split = COLOURS_WANTED / 10
    if palette_split < 1:
        columns = COLOURS_WANTED
        rows = math.ceil(palette_split)
    else:
        columns = 10
        rows = math.ceil(palette_split)
Now we loop through each RGB from our colour_extracts list, and create an img. For each RGB value, we divide by 255 to convert it into a proportional float.
  for i in range(COLOURS_WANTED):
        print(f"""Rank {i} Colour: R:{colour_extracts[i][0]} G:{colour_extracts[i][1]} B:{colour_extracts[i][2]}, Proportion:{colour_extracts[i][3]}""")
        img = [[(colour_extracts[i][0]/255, colour_extracts[i][1]/255, colour_extracts[i][2]/255)]]
Finally, we plot the img onto our figure, number the colour on our palette and save the plotted image (our colour palette) to a .jpg file.
        fig.add_subplot(rows, columns, i + 1)
        plt.axis('off')
        title_name = str(i+1)
        plt.title(title_name, fontsize=30)
        plt.imshow(img)
        plt.subplots_adjust(wspace=0, left=0.02, right=0.98)
        # plt.show()
        plt.savefig('exports/' + folder + '.jpg')
Output Palette

The output here works well for the most part, however there are improvements which can be made:
- The same RGB colour could be displayed multiple times - here, the proportions should be summed
- Slightly different shades of the same colour will be counted separately which can skew certain images.
- Larger image files will take longer to process - a compression function is required to optimise this step.
The main improvement which we can make is assign 'names' to our RGB values which will allow us to combined multiple shades of the same colour into one.
RGB Conversions to Colour Names
The first step to convert RGB to colour names is to edit our colour extraction function.
Here, while looping through each colour extracted, we call a new function, using the webcolors module. Credit to this thread for the closest colour algorithm here
def get_colour_name(requested_colour):
    try:
        rgb_to_colour_name = actual_name = webcolors.rgb_to_name(requested_colour)
    except ValueError:
        rgb_to_colour_name = closest_colour(requested_colour)
        actual_name = None

    return rgb_to_colour_name
the above function takes in the RGB values (requested_colour) and calls the webcolors.rgb_to_name function to find a matching colour, with the help of it's HTML and CSS colour index
The problem here is if webcolors doesn't find a match, an error will be thrown out. Here, we need a function to find the closest colour to our RGB values
We can match each RGB value to its closest Euclidian distance in the RGB space.
def closest_colour(requested_colour):
    min_colours = {}
    for key, name in webcolors.css3_hex_to_names.items():
        r_c, g_c, b_c = webcolors.hex_to_rgb(key)
        rd = (r_c - requested_colour[0]) ** 2
        gd = (g_c - requested_colour[1]) ** 2
        bd = (b_c - requested_colour[2]) ** 2
        min_colours[(rd + gd + bd)] = name

    return min_colours[min(min_colours.keys())]
Now, instead of having a list of RGB and proportion values, we instead have a list of the most common colour names.
Here, we can use the Counter functions to count and get the most common colours in our list. We can also save the colour proportions (if we want to use them for another use).
Our colour palette will still need to use RGB values, so we simply convert our colour names back to RGB values using webcolors.name_to_rgb
def print_palette(folder):
    top_colours = Counter(extract_colour_names(folder))
    top_colours = colour_names.most_common(9999)
    colour_rgb_values = []
    colour_names = []
    colour_proportions = []

    for colour in top_colours:
        RGB = webcolors.name_to_rgb(colour[0])
        colour_rgb_values.append(RGB)
        colour_names.append(colour[0])
        colour_proportions.append((folder, colour[0], colour[1]))
Now, everthing should be good to go!
Main Function
def print_palette(folder):
top_colours = Counter(extract_colour_names(folder))
top_colours = colour_names.most_common(9999)
colour_rgb_values = []
colour_names = []
colour_proportions = []
for colour in top_colours:
RGB = webcolors.name_to_rgb(colour[0])
colour_rgb_values.append(RGB)
colour_names.append(colour[0])
colour_proportions.append((folder, colour[0], colour[1]))
fig=plt.figure(figsize=(24, 14))
plt.title(folder.title(), fontsize=25)
plt.axis('off')
COLUMNS = 5
ROWS = 2
row_count = 0
for i in range(1, COLUMNS*ROWS +1):
img = [[(colour_rgb_values[row_count][0]/255, colour_rgb_values[row_count][1]/255, colour_rgb_values[row_count][2]/255)]]
fig.add_subplot(ROWS, COLUMNS, i)
plt.axis('off')
plt.title(colour_names[row_count].capitalize(), x=0.5, y=0.5, fontsize=30)
plt.imshow(img)
plt.subplots_adjust(wspace=0, left=0.02, right=0.98)
row_count += 1
for i in colour_proportions:
print(i)
# plt.show()
plt.savefig('exports/' + folder + '.png')
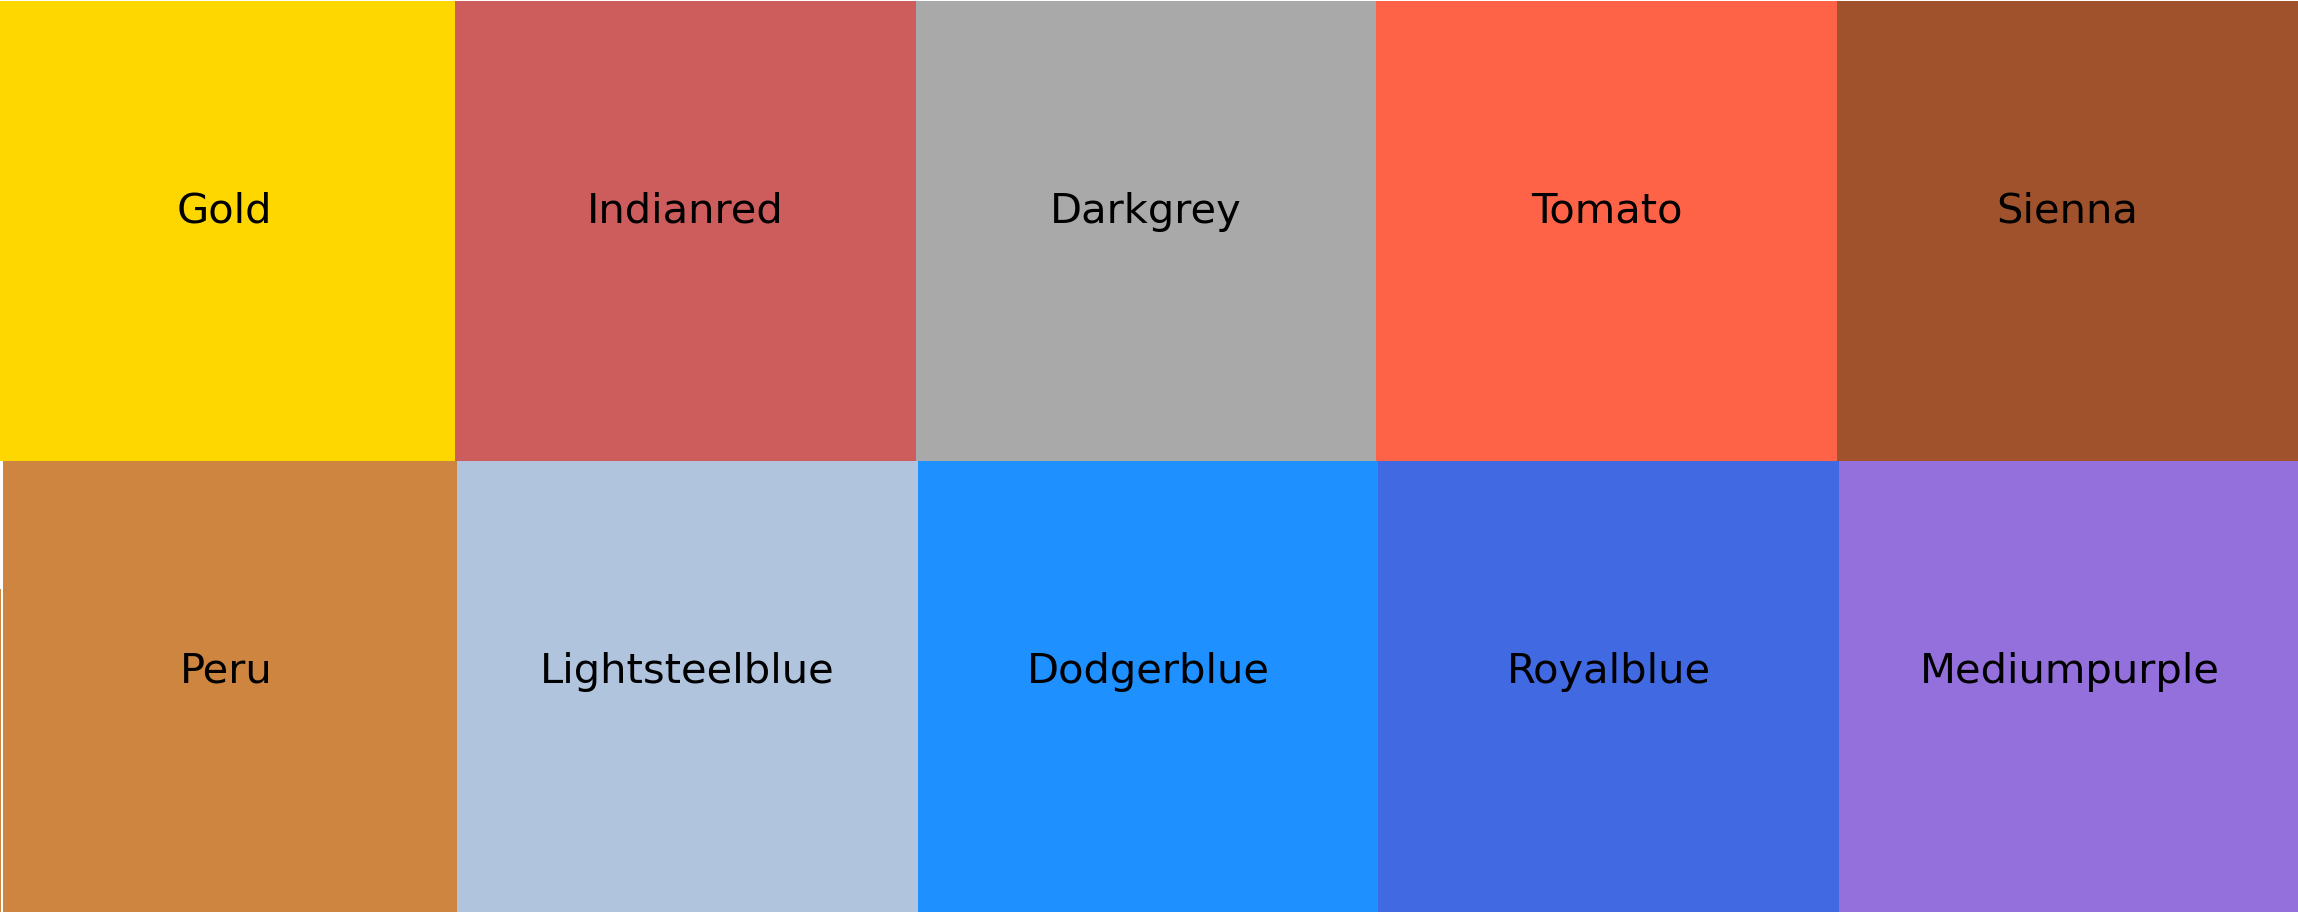
return colour_proportionsFinal Output Palette - RBG to HTML/ CSS Colour Names